In this Article
The Food and Agriculture Organization of the United Nations (FAO) and the United Nations Industrial Development Organization (UNIDO) created a guide for developing sustainable food value chains using a rigorous and standardized approach to value chain (VC) analysis and design.

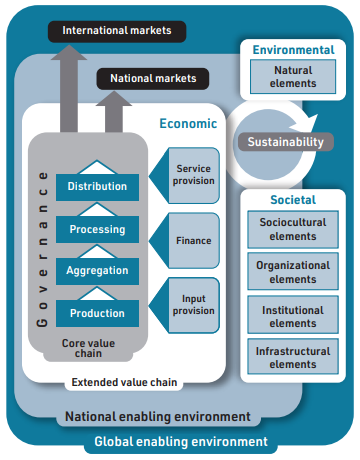
A food value chain includes all actors involved, from production or capture to final consumption, along with their coordinated value-adding activities that transform raw materials into food products. The value chain development approach adopts a holistic perspective, examining all components – actors, support providers, operational environments, complex interlinked behaviors, and technical, economic, social, and environmental performance – to formulate an upgrading strategy to enhance the chain’s sustainability impact and resilience.

FAO and UNIDO developed practical guidance for systems-based analysis and design to develop sustainable food value chains. This brief is structured into four key components. The first two, functional and sustainability analyses, comprise the VC analysis. The final two components, an upgrading strategy, and a development plan, constitute the VC design.
The functional analysis focuses on describing and understanding the structure and dynamics of the value chain. It covers three main aspects: identifying VC elements, examining stakeholders’ behaviors, interactions, and dimensions, and identifying root causes of underperformance. The analysis seeks to understand why VC actors make specific choices regarding markets, technologies, or governance methods. This holistic analysis is conducted through four systematic steps, each offering opportunities to identify potential upgrading strategies.

The sustainability assessment aims to evaluate the VC’s performance regarding its economic, social, and environmental impacts and identify key sustainability issues. It consists of five parts: detailed evaluations of economic, social, and environmental impacts; an examination of the VC’s resilience to external shocks, such as economic crises or natural disasters; and a heat map that summarizes the overall sustainability performance. The heat map uses red, yellow, and green indicators to prioritize areas of concern: red indicates a high-concern area, yellow indicates a sustainability concern that needs to be addressed in the medium term, and green indicates no significant or immediate sustainability concerns.
Table 1. Example of a value chain sustainability heat map
|
Economic Sustainability |
Social Sustainability |
Environmental Sustainability |
|
Net income |
Job-related income distribution |
Electricity use |
|
Trend in net income |
VA distribution |
Fuel consumption |
|
Return on sales |
Poverty |
Renewable clean energy use |
|
Return on investment |
Discrimination |
Carbon footprint |
|
Number of jobs in full time equivalent (FTE) |
Women’s economic involvement |
Water and ice consumption |
|
Number of FT jobs |
Gendered division of labour |
Water pollution |
|
Number of wage labour jobs |
Gendered access to resources |
Soil erosion |
|
Number of family/self-employed jobs |
Women’s decision-making and leadership |
Soil fertility |
|
Average wage for hired workers |
Food availability |
Associated species |
|
Average wage for proxy family labour |
Food accessibility |
Vulnerable ecosystems |
|
Total value of net wages |
Food utilization (nutrition, safety) |
Endangered, threatened and protected (ETP) species |
|
Direct value added (VA) at VC level |
Food supply stability |
Genetic resource use |
|
Indirect VA at VC level |
Labour rights |
Stock status and dynamics |
|
Total VA |
Child and forced labour |
Plant biosecurity |
|
Contribution to trade balance |
Job safety and security |
Plant growing practices |
|
Rate of integration |
Job attractiveness |
Animal biosecurity |
|
Net impact on public finances |
Collective action |
Animal husbandry |
|
Private investment |
Coordination of transactions |
Feed and fertilizer use |
|
Nominal protection coefficient |
Social cohesion |
Use of drugs and chemicals |
|
Direct resource cost ratio |
Cultural traditions |
Air pollution |
|
Consumer surplus |
Policy and regulations |
Inorganic waste pollution |
|
Consumer evaluation |
Access to finance |
Organic waste pollution |
|
Consumer preference |
Access to natural resources |
Food loss |
|
Price relative to substitutes |
Access to information |
Food waste |
|
Resilience |
||
|
Redundancy |
Diversity |
Connectivity |
|
Collaboration |
Learning and adaptation |
Participation and inclusion |
|
Key |
||
|
Not concerning |
Concerning |
Highly concerning |
Meanwhile, upgrading strategy consists of strengths-weaknesses-opportunities-threats (SWOT) analysis, vision, upgrading strategy and theory of change (ToC), and upgrading activities. The last component is translating the core strategy into a concrete VC development plan for implementation. The VC development plan describes how each stakeholder’s agreed-upon contributions will contribute to the realization of the vision. It consists of four main components: (1) overall log-frame for VC upgrading; (2) activities and investment tables, with financing mechanism; (3) sustainable food value chain (SFVC) facilitation project design and (4) risk analysis with mitigation strategy.
Reference: FAO and UNIDO. 2024. Developing sustainable food value chains – Practical guidance for systems-based analysis and design. SFVC Methodological Brief. Rome, FAO and Vienna, UNIDO. https://doi.org/10.4060/cc9291en


